
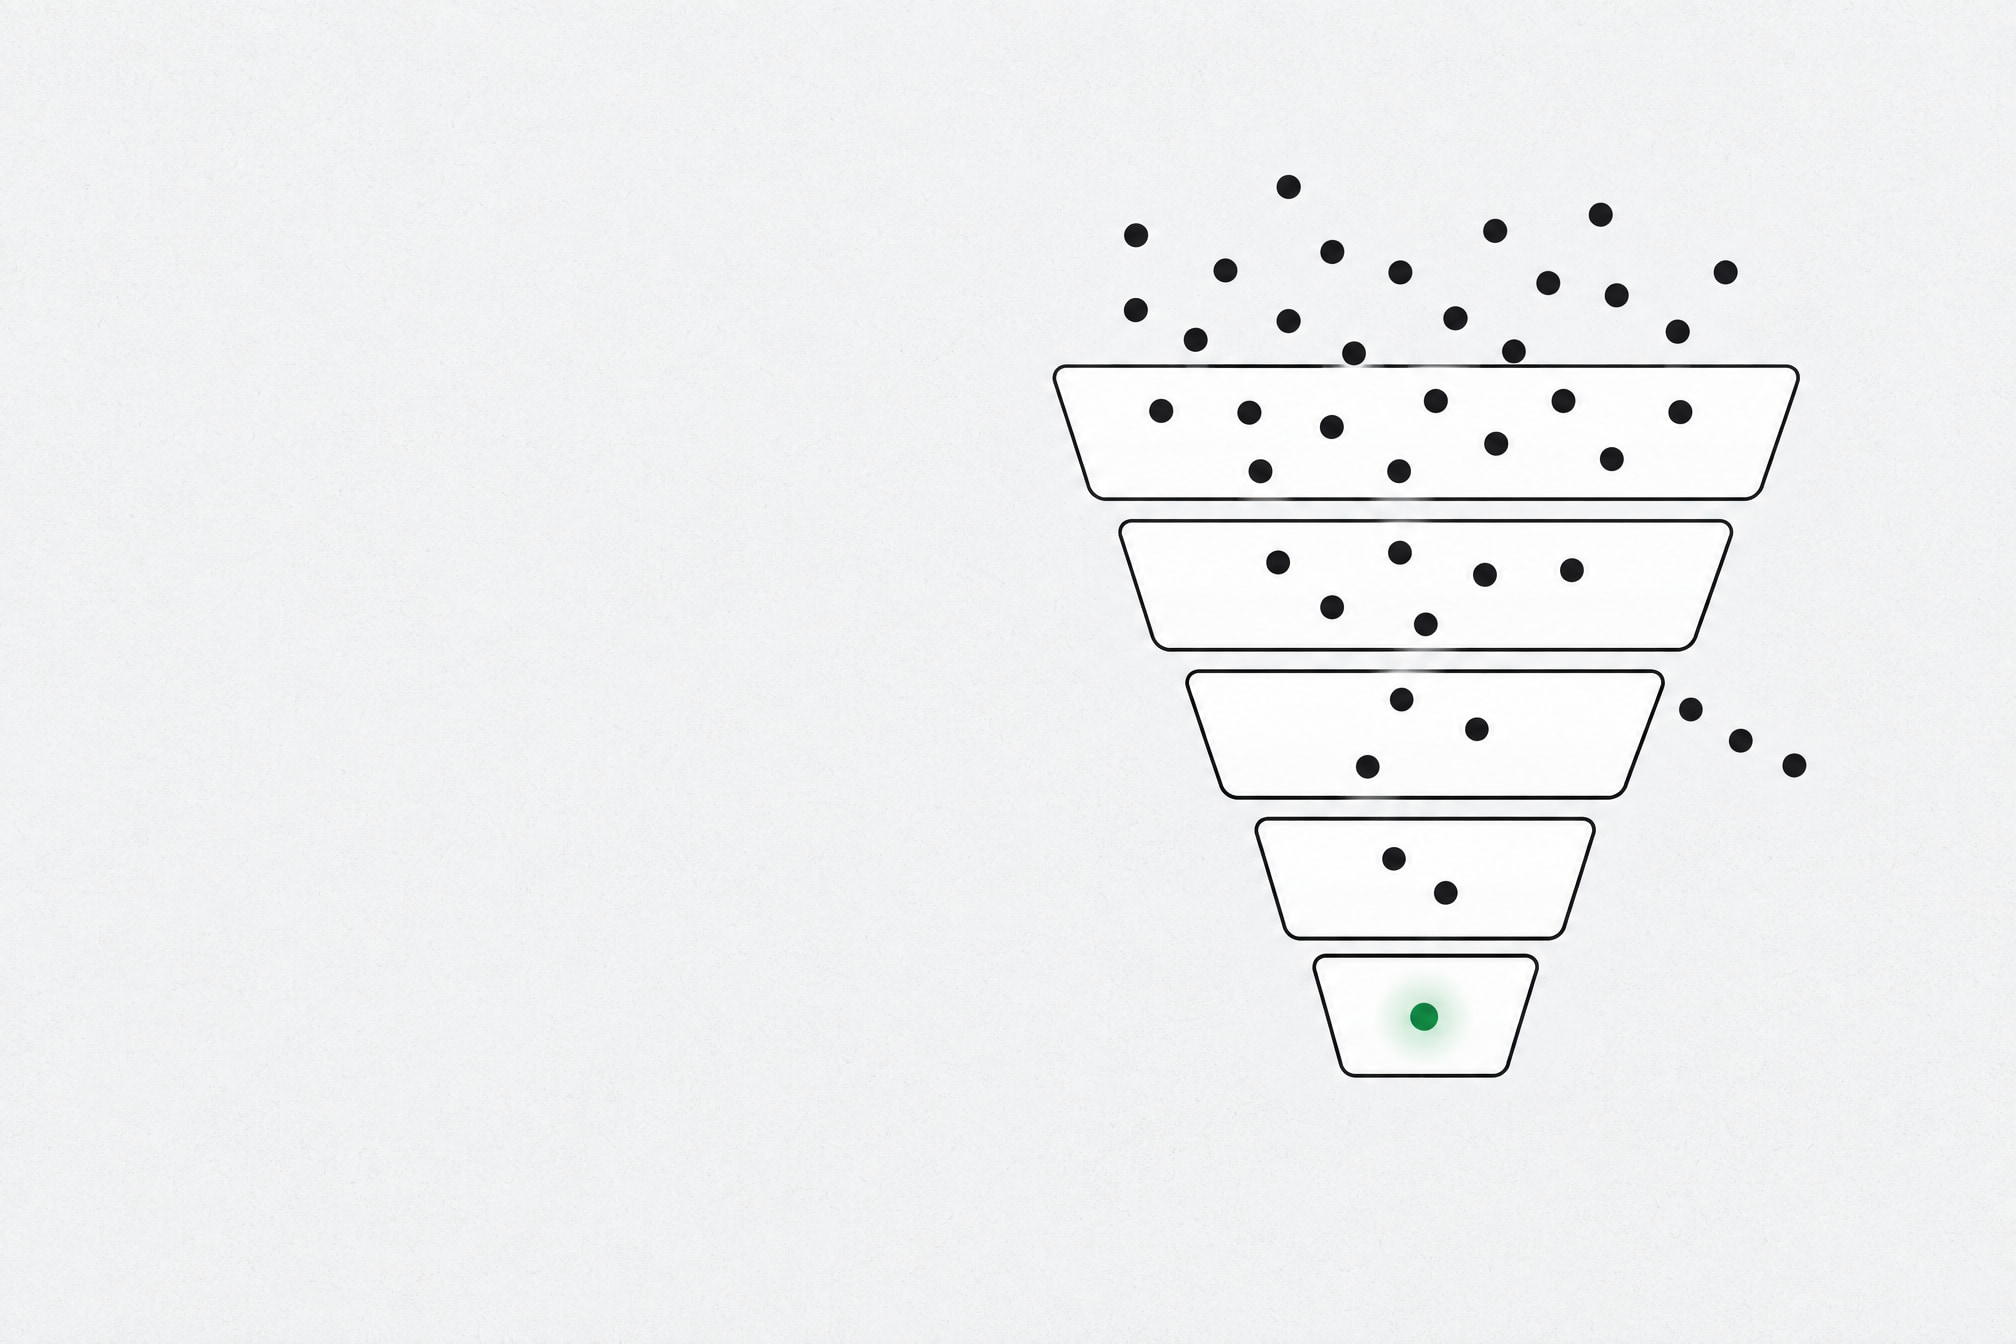
A conversion funnel is a model of the steps a visitor takes before completing a goal, such as a purchase, a sign-up, or a paid plan. The conversion funnel is wide at the top, where many visitors arrive, and narrow at the bottom, where a smaller group converts. Common stage lists run from awareness and interest to consideration, intent, evaluation, conversion, and retention. You read a conversion funnel by dividing the users at each step by the users at the step before, which shows exactly where people drop off.
The visit. The journey. The sale. Most funnel guides stop at a neat diagram with seven colored bands, and that diagram won't show you where your revenue leaks out. The counts between each step will.
What Is a Conversion Funnel?
A conversion funnel is the sequence of stages a user passes through before completing a goal on your site, such as buying a product, signing up, or starting a paid plan.
The name comes from the kitchen tool. Wide at the top. Narrow at the bottom. Lots of people land on your homepage, fewer open a product page, fewer again add something to a cart, and only some of those pay.
That narrowing is normal. Nobody converts every visitor. You want to know which step narrows faster than it should.
A Conversion Funnel Turns Vague Problems Into Fixable Ones
A conversion funnel turns a vague problem like "sales are down" into a specific one, like "mobile shoppers keep leaving on the shipping step."
You can't fix the first sentence. You can fix the second one this week. It's a simple map of the customer journey, and the stages are where the map starts.
The Seven Conversion Funnel Stages, From Awareness to Retention
The conversion funnel stages usually run from awareness to interest, consideration, intent, evaluation, conversion, and retention, and each stage holds fewer people than the one before it.
Where the Funnel Stages Came From
Conversion funnel stages come from the AIDA model, which stands for Attention, Interest, Desire, and Action. Oxford Reference credits St Elmo Lewis with developing AIDA in 1898 to explain how personal selling works.
That tidy origin story is shakier than it looks. A scholarly history of the AIDA model says it is "very difficult to determine who originally invented AIDA," and notes that Lewis's own early wording left out Desire and Action.
The model kept changing after that. EBSCO's research overview of AIDA says Edward Strong revised and promoted it in the 1920s. So today's funnel is more than a century of edits, and retention stages were added later still.
The Seven Funnel Stages in Order
The seven stages of a modern conversion funnel, with what each looks like on a typical online store, are:
Awareness: a visitor finds you through search, an ad, a newsletter, or a shared link.
Interest: they stay and read a second page, a product page, or a blog post.
Consideration: they compare options, open the pricing page, or check sizes and plans.
Intent: they give a clear signal, like adding to cart or starting a free trial.
Evaluation: they do the last checks, such as reviews, shipping costs, and return rules.
Conversion: they pay, sign up, or upgrade.
Retention: they come back and buy again.
One warning. The AIDA model lays its stages out as a straight line, and real visitors skip around. Someone can go from a search result to checkout in two clicks.
Stages are good for thinking. For measuring, you need steps you can count, and grouping them into three zones is the easiest place to start.
ToFu, MoFu, BoFu: Top, Middle, and Bottom of the Funnel
Top of funnel (ToFu), middle of funnel (MoFu), and bottom of funnel (BoFu) are three zones that group the conversion funnel stages by what the visitor is doing: arriving, deciding, or buying.
ToFu covers awareness and interest. These are visitors. Before you spend more on any channel, check which acquisition channels bring visitors in and which ones bring the right visitors.
MoFu covers consideration and intent. Visitors become leads here, through pricing pages, comparison pages, demo requests, and email sign-ups.
BoFu covers evaluation and the final decision. Leads become customers. Checkout, payment options, and trust signals decide this zone.
Retention sits after the bottom. From visitor to customer to regular.
Most advice pushes you to buy more traffic. Fix the bottom first. Pouring extra visitors into a leaky checkout just means more people leaving at the same spot.
Conversion Funnel vs. Sales Funnel vs. Marketing Funnel
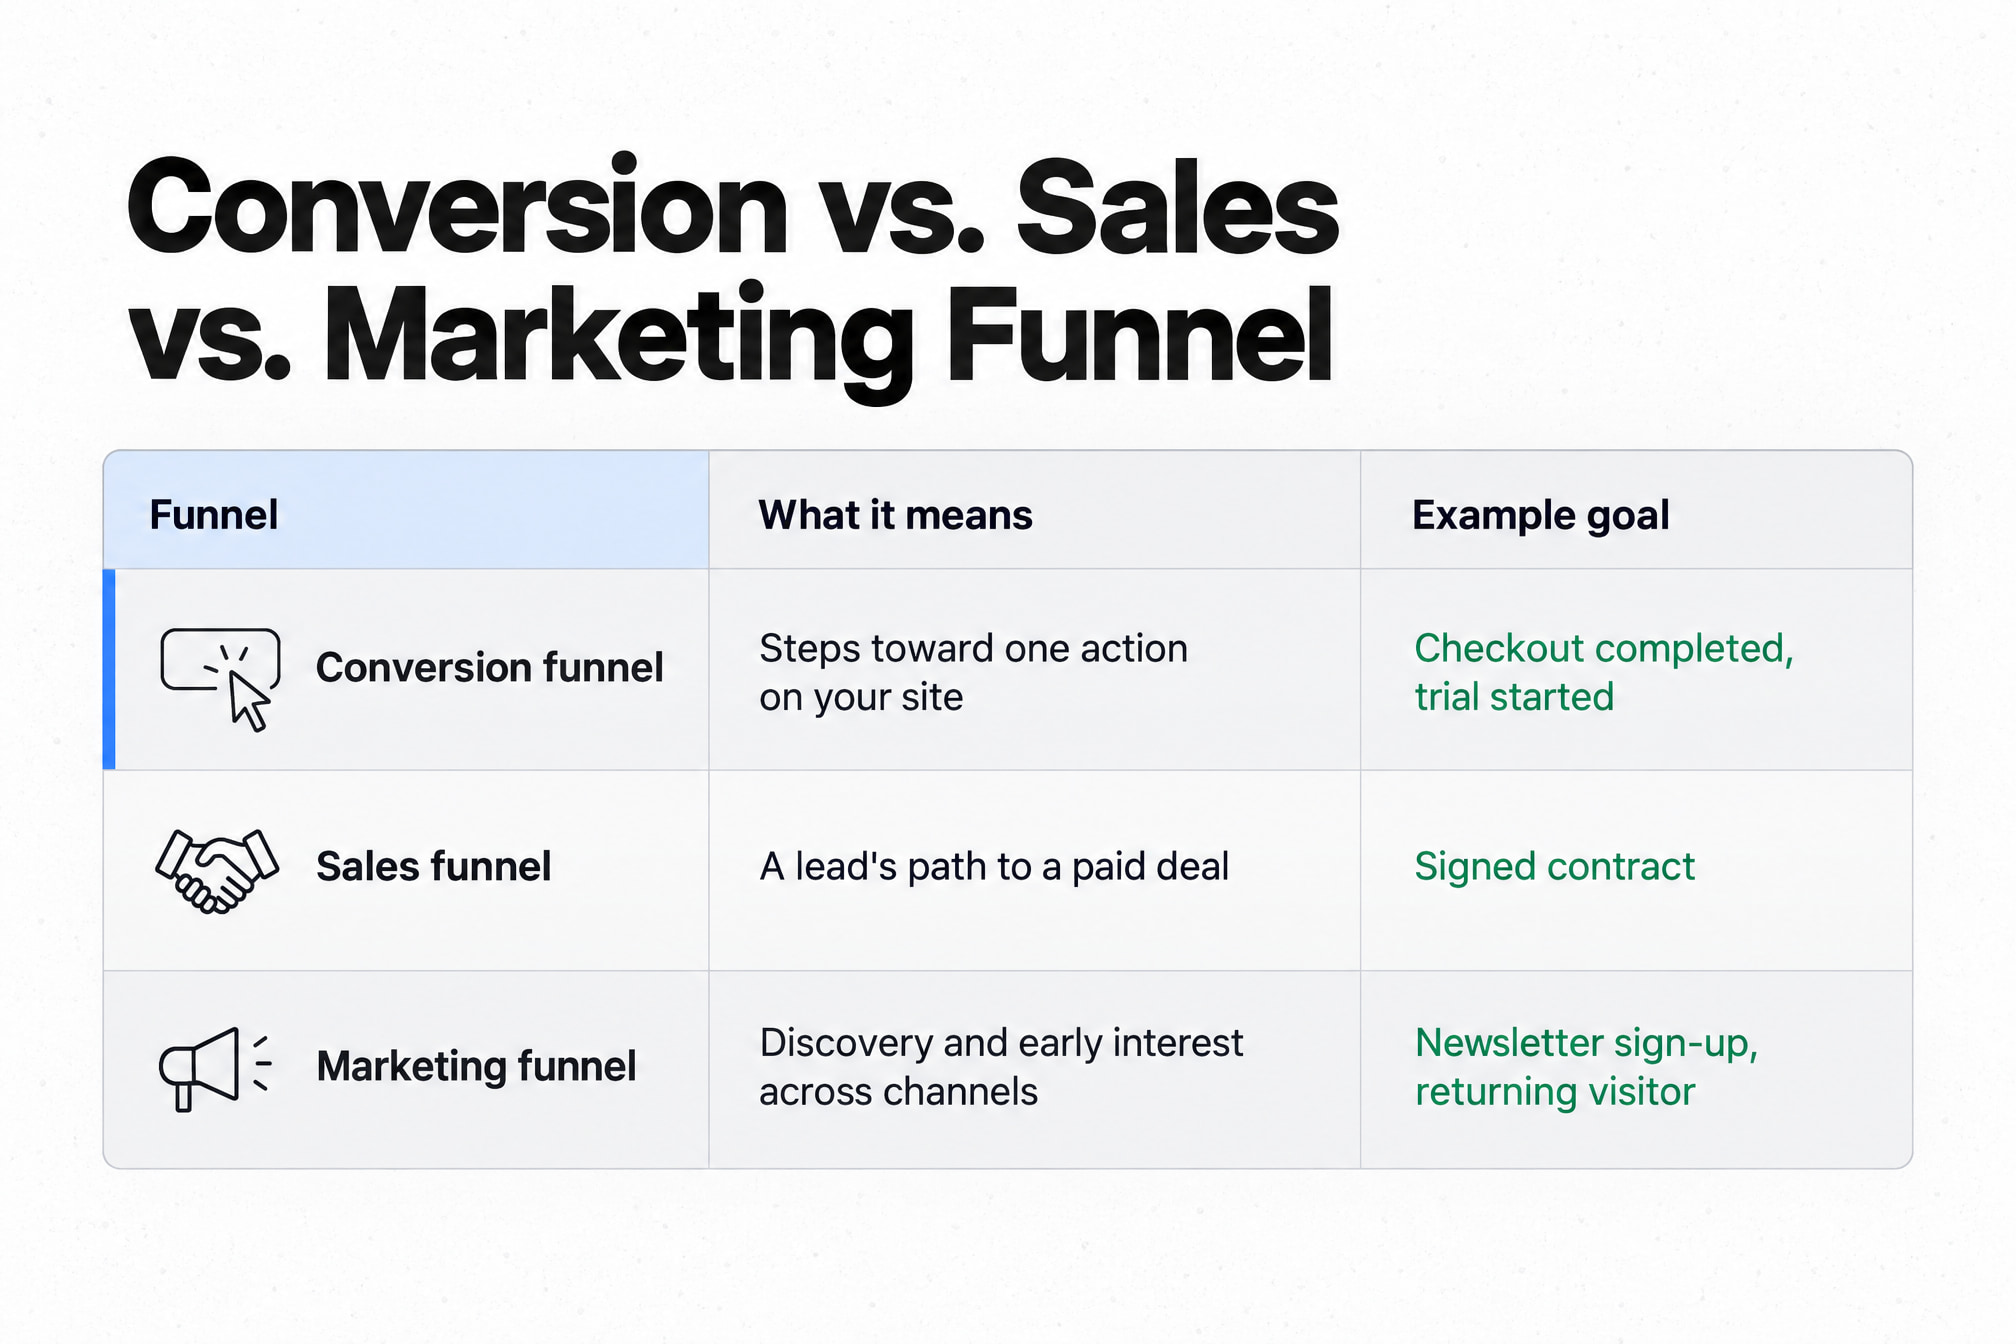
A conversion funnel tracks the steps toward one goal on your site, a sales funnel tracks a lead's path to a closed deal, and a marketing funnel tracks how people discover and warm up to a brand.
People use the three terms loosely, and they overlap a lot. The difference is mostly scope.
The three funnel types compare like this:
Funnel | What it follows | Example goal |
|---|---|---|
Conversion funnel | Steps toward one action on your site | Checkout completed, trial started |
Sales funnel | A lead's path to a paid deal, often with a sales rep involved | Signed contract |
Marketing funnel | Discovery and early interest across channels | Newsletter sign-up, returning visitor |
All three sit inside the wider customer journey. A customer journey map draws the whole path, including the parts you can't track, like a friend's recommendation over coffee.
For a SaaS product, the conversion funnel is often short. Visit, free trial, trial conversion, paying customer. Four steps you can count, which brings us to the counting.
Conversion Funnel Metrics and Formulas, With a Worked Example
Conversion rate is the core conversion funnel metric, and you calculate it by dividing the users who completed a step by the users who reached the step before it.
Almost every funnel metric is a variation on that one division. The main formulas are:
Metric | Formula | What it tells you |
|---|---|---|
Step conversion rate | Users at a step ÷ users at the previous step | How well one step passes people forward |
Overall conversion rate | Users completing the final step ÷ users entering the funnel | How the whole funnel performs |
Abandonment rate at a step | 1 minus that step's conversion rate | How many people leave at that step |
Add-to-cart rate | Product viewers who add to cart ÷ product viewers | Whether product pages persuade |
Cart abandonment rate | 1 minus (orders ÷ carts created) | How many carts never become orders |
Checkout conversion rate | Orders ÷ checkouts started | How smooth your checkout process is |
Bounce rate | Visits with no second action ÷ all visits | Whether landing pages hold attention |
Session duration | Average length of a visit | Whether people stay long enough to decide |
A Worked Example for an Online Store
A worked example makes the conversion funnel formulas concrete, so take a hypothetical store with round numbers picked for easy math. In one month, 10,000 visitors arrive, 2,000 view a product, 600 add to cart, 300 start checkout, and 150 buy.
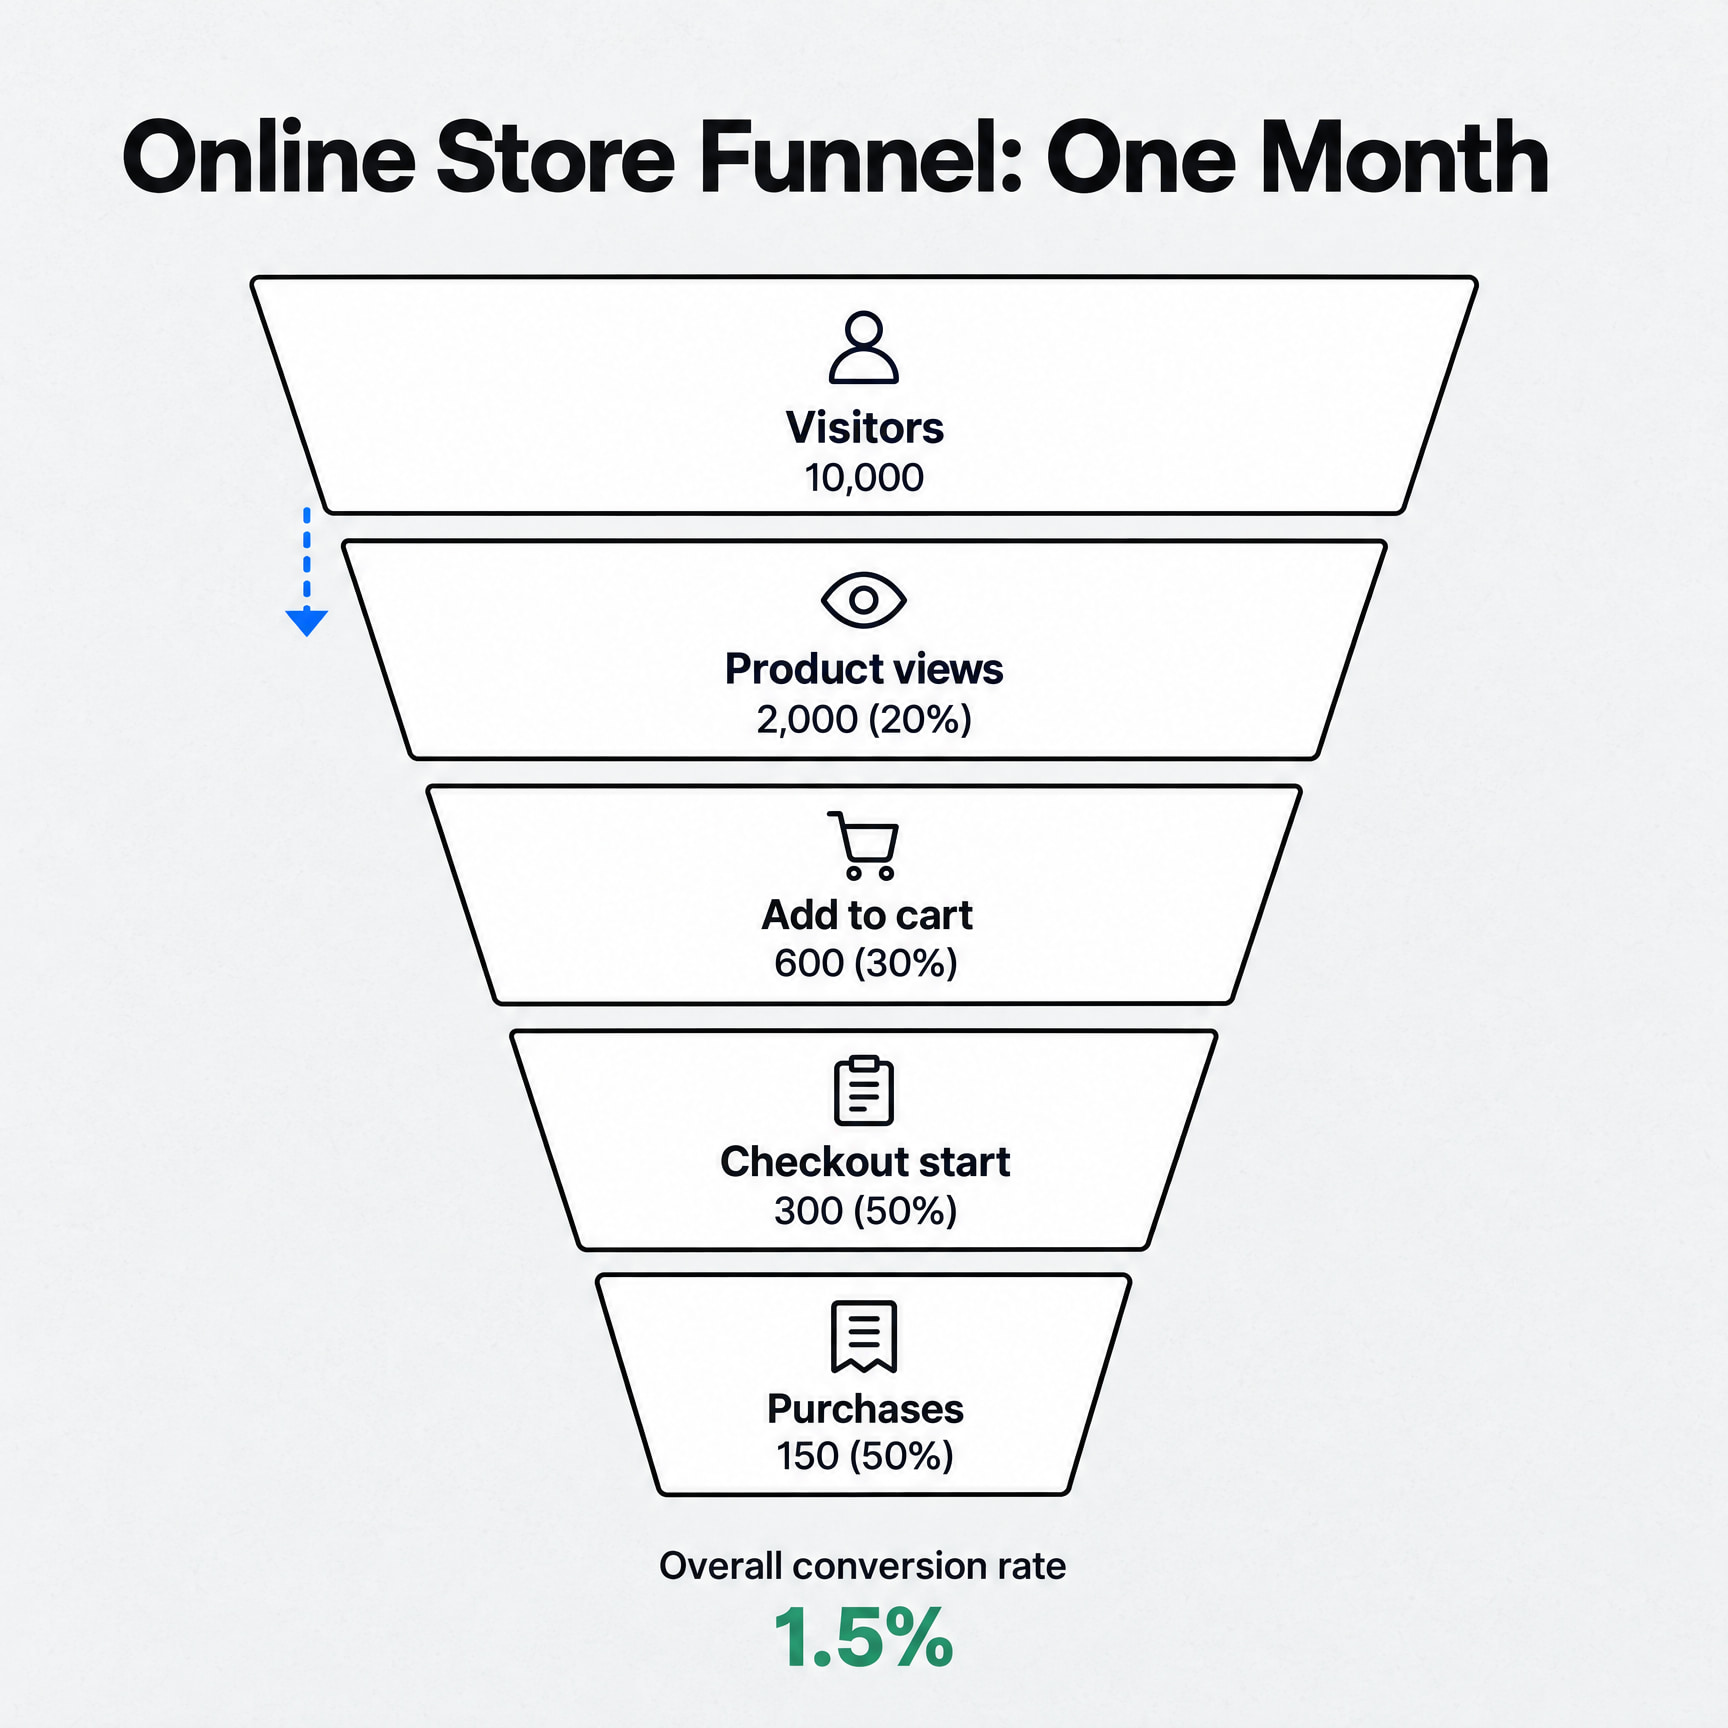
The step rates for this hypothetical store are:
Visit to product view: 2,000 ÷ 10,000 = 20%
Product view to add to cart (add-to-cart rate): 600 ÷ 2,000 = 30%
Add to cart to checkout start: 300 ÷ 600 = 50%
Checkout start to purchase (checkout conversion rate): 150 ÷ 300 = 50%
Overall conversion rate: 150 ÷ 10,000 = 1.5%
Cart abandonment here is 1 minus (150 ÷ 600), or 75%. The steepest drop is visit to product view, where 80% of people leave. That's where you'd look first, though the biggest drop and the easiest fix aren't always the same step.
What Is a Good Conversion Rate for a Funnel?
A good conversion rate depends on device, industry, and definition, and Contentsquare's 2026 benchmark data puts mobile web at about 2%, compared with 3.4% on desktop.
That gap matters when you read your own numbers. A store with mostly phone traffic will show a lower blended rate than a desktop-heavy one, before anyone touches the checkout.
The sample behind those figures is large. Contentsquare's 2026 Digital Experience Benchmark analyzed 99 billion sessions across more than 6,500 websites, so it's a fair reference point.
The trend is down. In that benchmark, conversion rate fell 5.1% year on year, measured as the share of visits with a conversion event. That's a relative change, so a 2% rate slips to about 1.9%.
And yet revenue across core industries rose 1% year on year. Fewer visits converted, and the money still edged up. Watch revenue next to conversion rate, because either one alone can mislead you.
Vendor benchmarks use different samples and definitions, so don't compare one report's number with another's. Your best benchmark is your own funnel last month.
How to Find Where Your Conversion Funnel Is Leaking
A conversion funnel leak is the step where drop-off is much steeper than at the steps around it, and you find it by comparing step conversion rates side by side, then splitting them by segment.
A site-wide conversion rate hides leaks. It blends search visitors, ad clicks, phones, laptops, first visits and fifth visits into one number. One number for all of them tells you very little.
Start with three splits: traffic source, device, and new versus returning visitors. Put the step rates for each segment next to each other and look for the one step where a single segment falls off a cliff.
For traffic source, tag your campaign links so each visit carries its origin. This walkthrough of how UTM tracking attributes your website traffic covers the setup.
Check the size of each segment before you act. Contentsquare found AI-referred traffic converted at 1.3% in 2025, up 55% year on year, yet it made up only 0.2% of total traffic in Q4. A fast-growing segment can still be too small to move your revenue.
Then follow a handful of individual visitor journeys through the leaky step. Look at the last page and the last click before each person left.
Averages show you where. Single journeys show you why.
How to Optimize Your Conversion Funnel, Step by Step
You optimize a conversion funnel by fixing one leaking step at a time, starting with the step that loses the most people, and measuring that step's rate before and after each change.
Change one thing, wait for enough traffic, compare. Ship four changes at once and you won't know which one worked.
Clean Up the Landing Page
A landing page should have one clear headline, one call-to-action, and very little else competing for attention.
Read your headline out loud and rewrite it if it doesn't say what you sell and who it's for. Then count the buttons above the fold. Keep one main call-to-action and cut the clutter around it.
Make Pages Load Faster on Mobile
Mobile page speed changes how many shoppers move from one funnel step to the next. In a Google-commissioned study by 55 and Deloitte covering 37 brands and more than 30 million sessions in late 2019, a 0.1-second mobile speed gain raised retail progression from product page to add-to-basket by 9.1%.
A tenth of a second. Less than a blink, and it showed up at the step where plenty of stores lose people. Retail shoppers in that study also spent 9.2% more.
Open your product page on a real phone over a slow connection. Compress big images, drop scripts you don't use, and make buttons easy to tap. Responsive design and simple navigation go on the same list.
Personalize the Middle of the Funnel
Personalization in the middle of the funnel means showing people content based on what they already looked at, through email, on-site messages, or targeted ads.
Someone who read your pricing page twice doesn't need another intro email. Send the plan comparison or the billing FAQ instead. Match the message to the last thing they did.
Keep the Customers You Already Have
Retention is the funnel stage that pays off longest, and Bain & Company found that in financial services a 5% increase in customer retention produces more than a 25% increase in profit.
That figure comes from late-1990s data in one industry, so don't paste it into a forecast. The direction still holds, because keeping a customer is generally cheaper than finding a new one.
Set up one follow-up after purchase, like a reorder reminder or a how-to email. Then track how many first-time buyers come back within a fixed window.
Cart Abandonment and the Checkout Process in E-commerce
Cart abandonment is when a shopper adds items to a cart and leaves without buying, and Baymard Institute's average of 50 studies puts online cart abandonment at 70.22%.
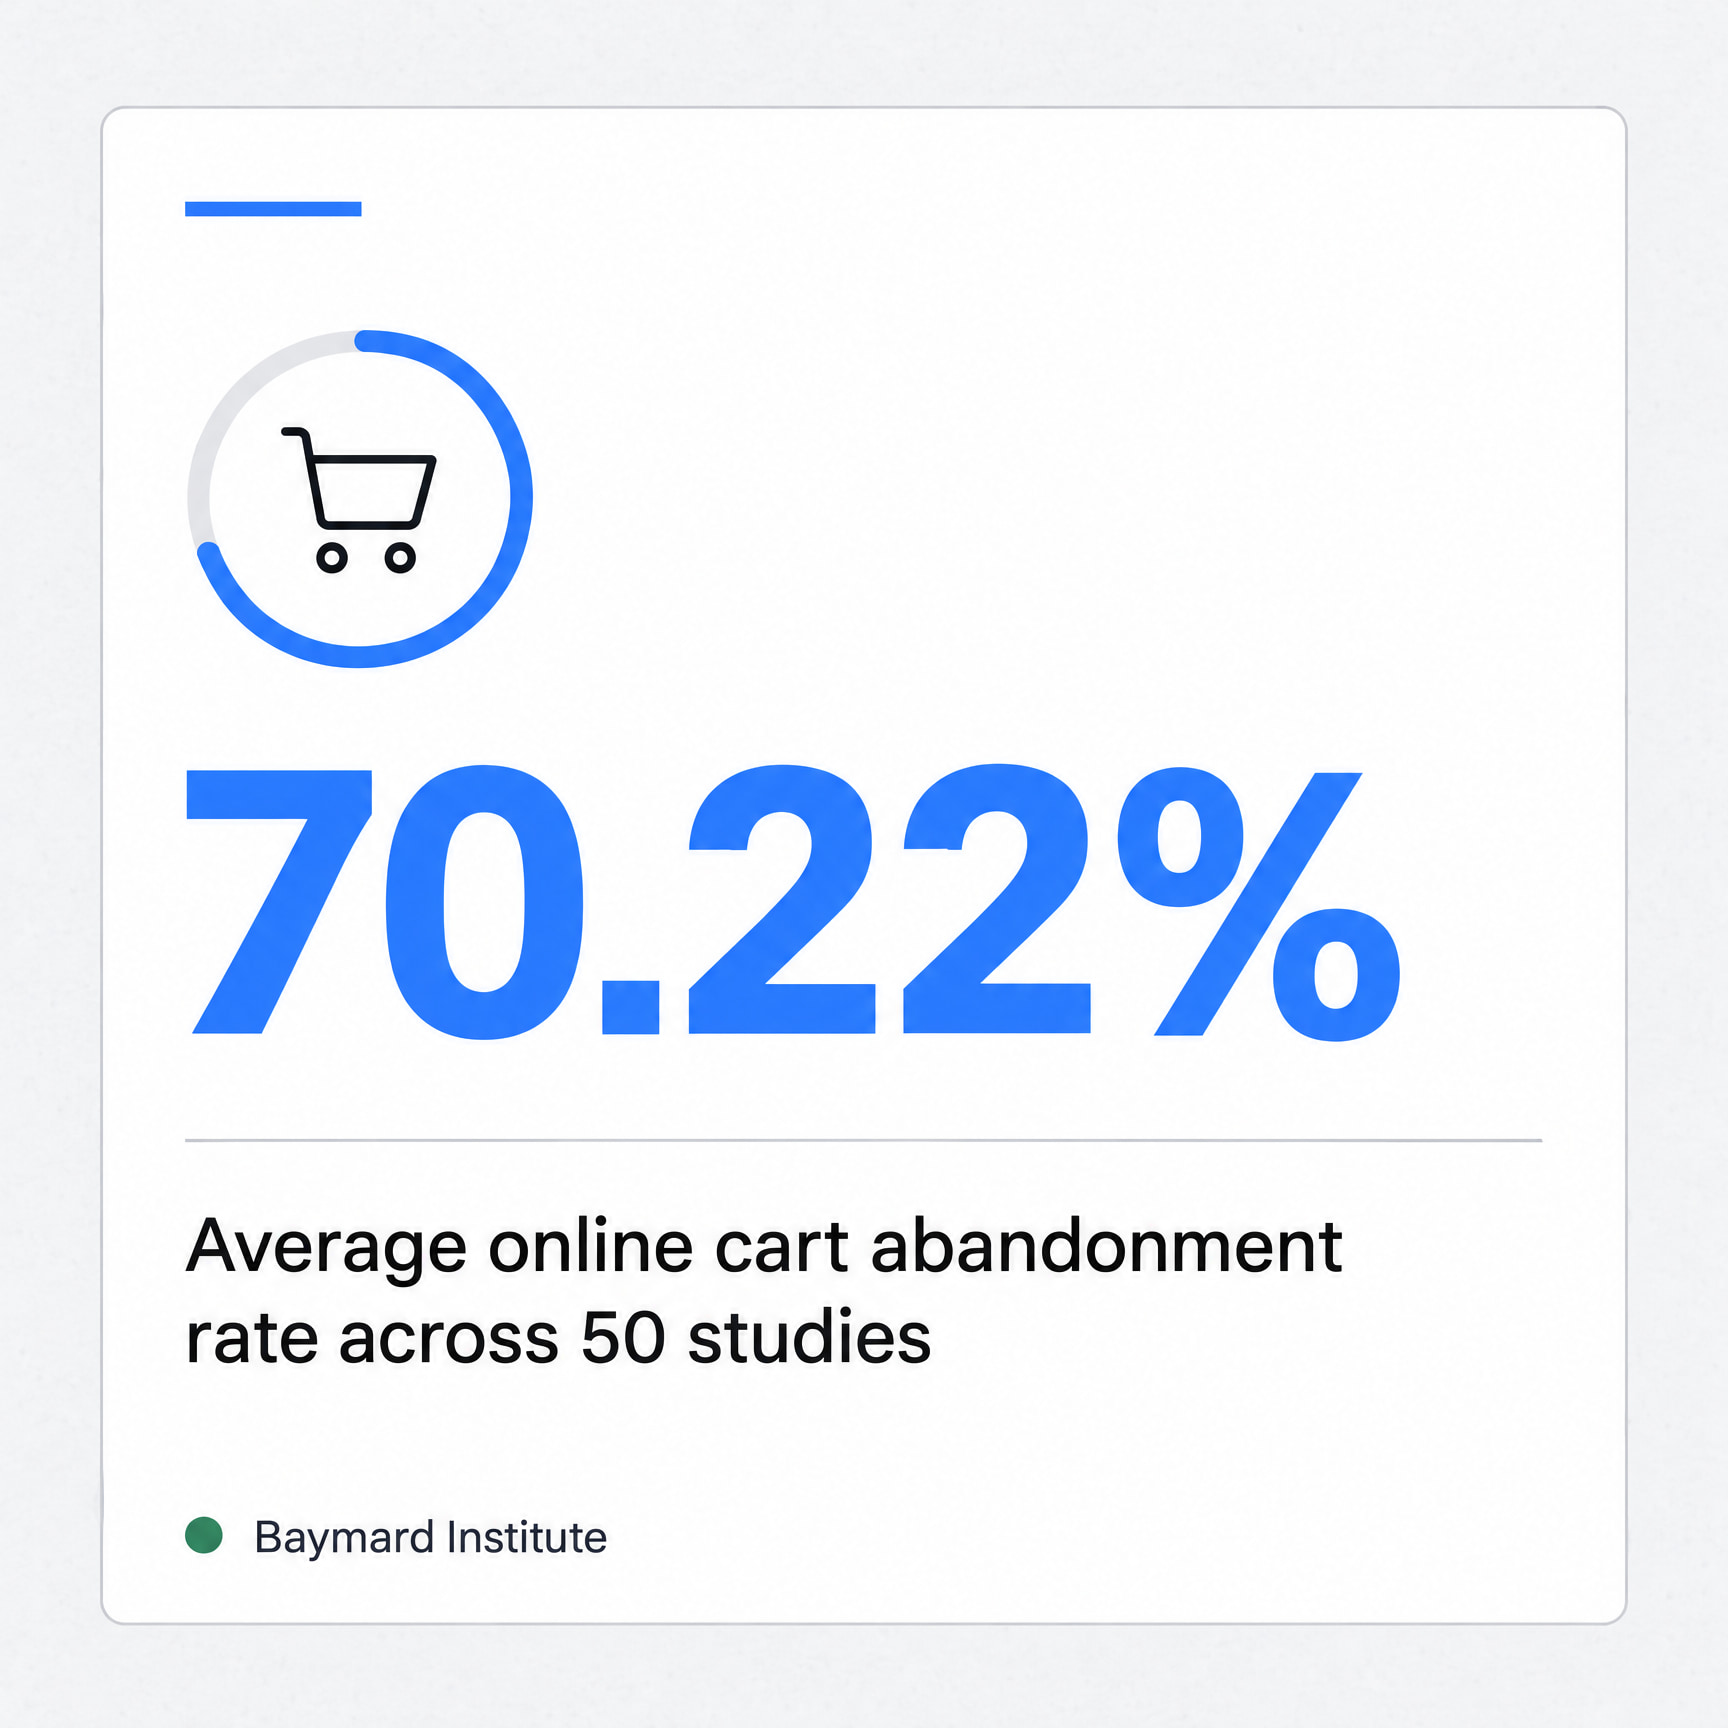
So most carts never become orders. Check your own cart abandonment rate against that figure before you panic. The number that matters is how yours moves after each change.
Surprise costs drive a lot of it. A February 2024 Baymard survey found 48% of US adults abandoned a cart because extra costs like shipping, tax, and fees were too high. That's a display problem as much as a pricing problem.
The checkout process fixes worth testing first are:
Show shipping, tax, and fees before the payment step.
Cut every form field you don't need, since shorter, simpler forms reduce friction.
Turn on browser auto-fill for address and card fields.
Offer the payment options your buyers already use.
Let people check out as a guest.
Put return policy and secure payment details right next to the pay button.
Then close the loop. Use revenue tracking that ties each purchase to its first visit, so you can see which sources bring buyers and which only bring full carts.
Tools for Tracking a Conversion Funnel: GA4, Mixpanel, Kissmetrics
Conversion funnel tracking tools such as Google Analytics 4, Mixpanel, and Kissmetrics count how many users reach each step you define and how many drop out between steps.
Every one of them needs the same thing from you first. A clear list of steps, each tracked as a page view or an event. The tool is the easy part.
Mixpanel and Kissmetrics are built around events, which suits SaaS funnels like sign-up, trial, and upgrade. Stattr works from one tracking script plus custom events that mark each funnel step.
You can connect your payments from Stripe, Paddle, or Lemon Squeezy to get the full picture from visitor to customer. Profiles stay anonymous by default, with identification only with consent.
Build Your First Conversion Funnel in Five Steps
Building a conversion funnel takes five steps, and the first one has nothing to do with software:
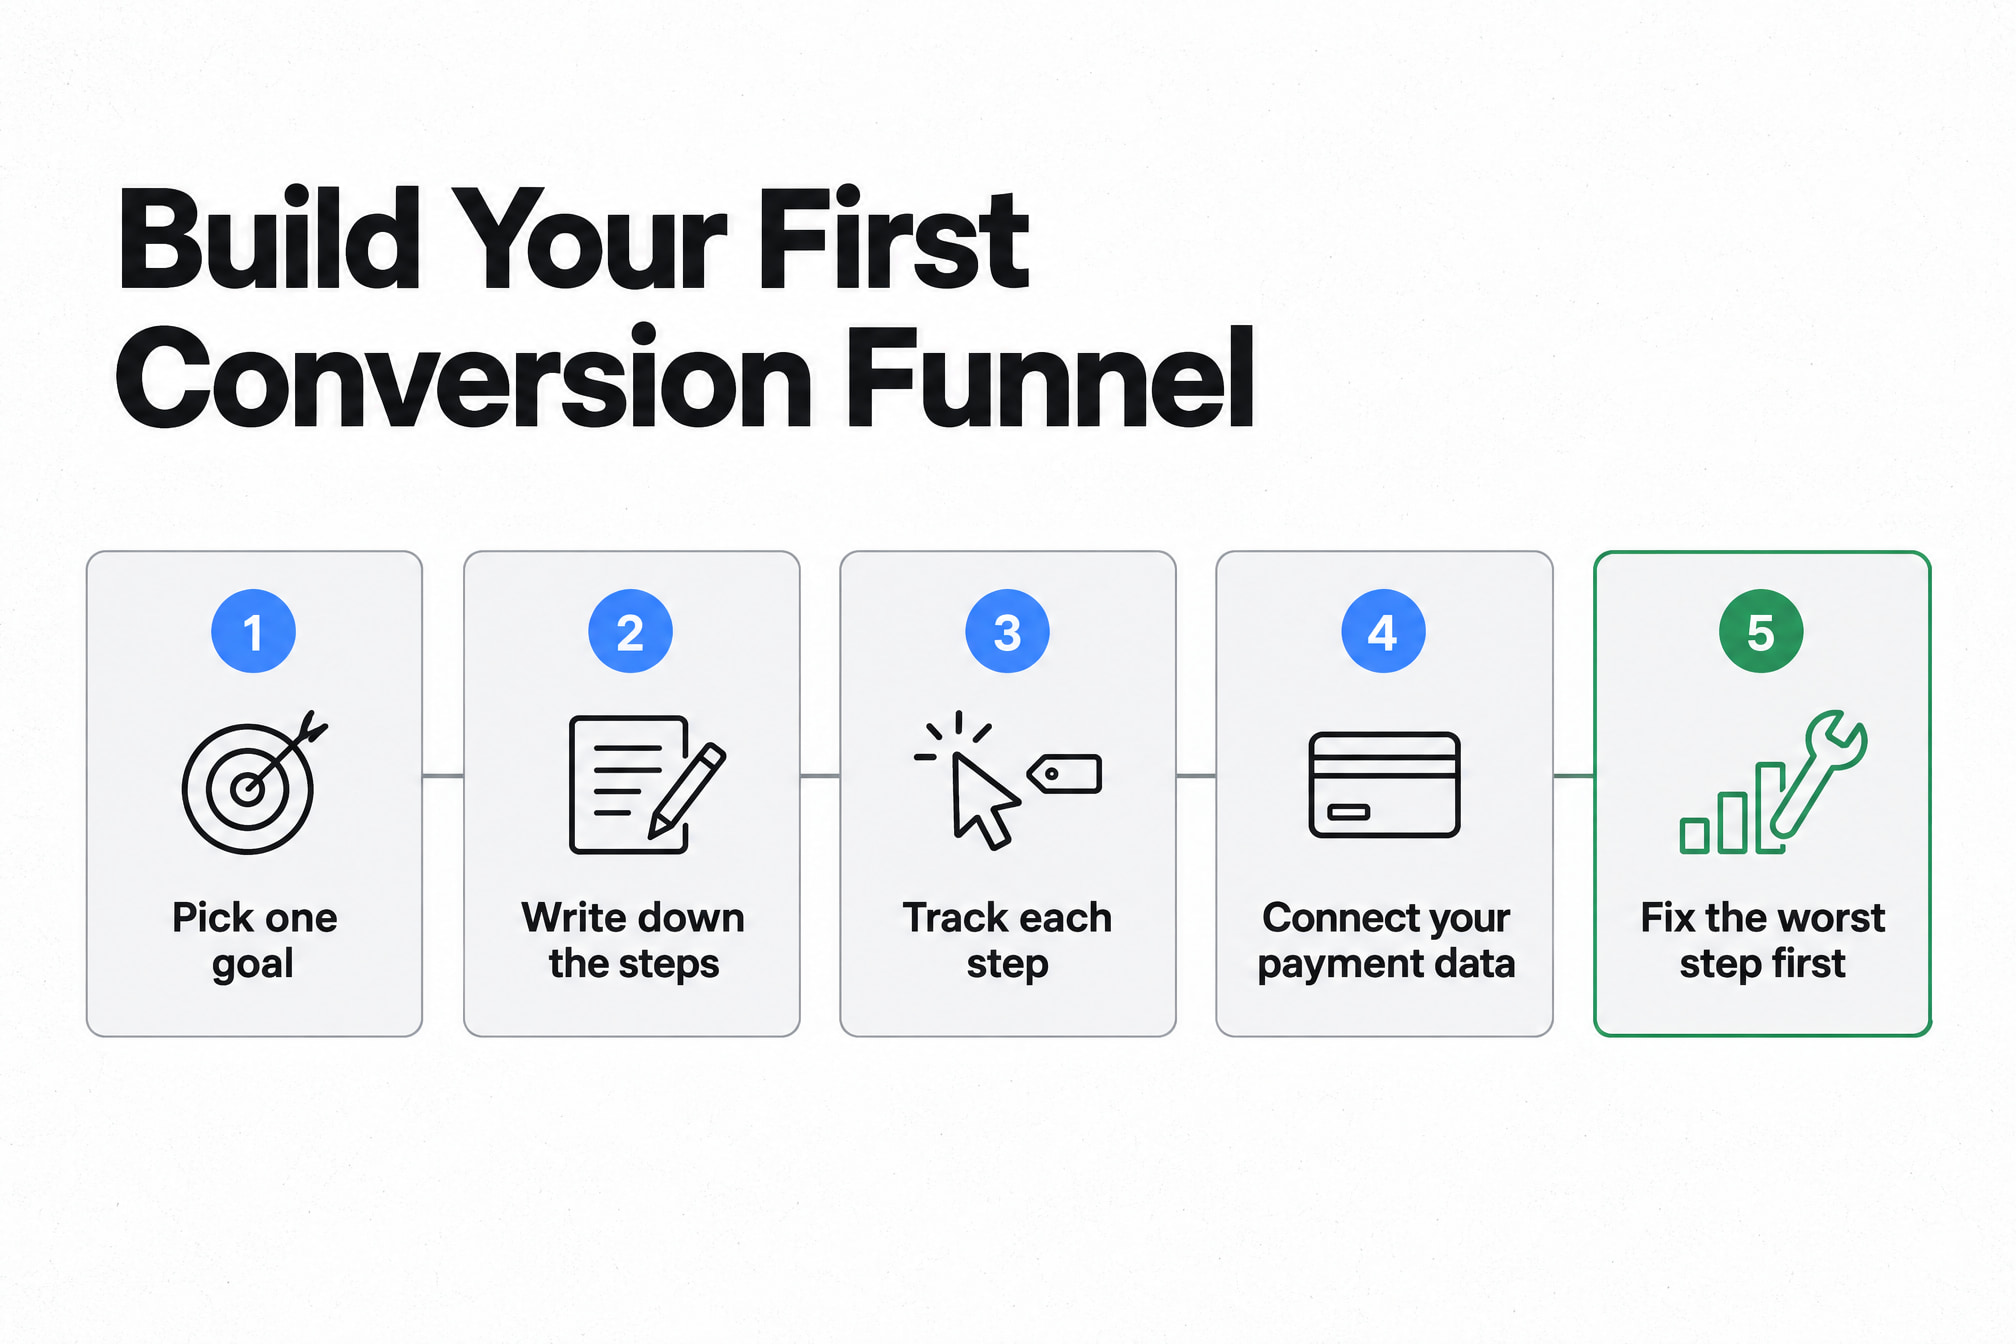
Pick one goal, such as a completed purchase or a started trial.
Write down the three to six steps a visitor takes to reach it.
Track each step as a page view or a custom event.
Connect your payment data so the final step records real revenue.
Check the step rates every week and fix the worst step first.
How to Set Up a Conversion Funnel in Google Analytics 4
Google Analytics 4 builds conversion funnels in the Explore section with a funnel exploration, which shows how many users complete or drop out at each step in standard or trended views.
The setting that trips people up is open versus closed. Google's GA4 funnel exploration documentation says users in a closed funnel must enter at step 1, and anyone who misses a step isn't counted later. In an open funnel, users can enter at any step.
One more detail from the same docs. If someone completes the funnel more than once in your date range, GA4 reports only the first sequence.
Use closed for a strict checkout, where a skipped step means something broke. Use open when people land midway, like on a product page from an ad. Then add a device breakdown and switch to the trended view to see whether a leak is new or old.
Conversion Funnel Quick Answers
What is a conversion funnel?
A conversion funnel is a model of the steps a visitor takes before completing a goal, such as a purchase or sign-up, drawn wide at the top and narrow at the bottom. It lets you measure how many people move from each step to the next.
What is a good conversion rate for a funnel?
A good funnel conversion rate varies by device and industry, and Contentsquare's 2026 mobile data shows mobile web converting at about 2% versus 3.4% on desktop. Compare against your own past numbers first, since vendor benchmarks use different definitions.
What is a conversion funnel in e-commerce?
An e-commerce conversion funnel usually runs from visit to product view, add to cart, checkout start, and purchase. Most carts never turn into orders, so the cart and checkout steps deserve close attention.
How do I set up a conversion funnel in Google Analytics?
You set up a conversion funnel in Google Analytics 4 by opening Explore, choosing a funnel exploration, adding each step as an event or page view, and picking an open or closed funnel. Add a device breakdown to spot where users drop off.
Start With One Funnel and Read It Every Week
The fastest way to improve a conversion funnel is to track one goal, find its worst step, and fix that step before touching anything else.
The order goes like this. Goal and steps first. Tracking second. A weekly read third. Then one fix at a time, with retention once the checkout holds up.
Today, write your funnel steps on paper. Five minutes, no software. Within seven days you should have a step conversion rate for every step and one step circled as the leak.
When you're ready to watch those steps fill in realtime, start tracking your funnel with Stattr and add your first custom event. A funnel you check every Monday beats a perfect one you built once and forgot.