


Content marketing ROI compares the revenue or value your content generates with what it costs to produce and distribute, usually written as (Revenue - Cost) / Cost x 100. The formula is easy. Using it well is not. In HubSpot's 2026 research, measuring marketing ROI was the top challenge marketers named, cited by 33%. Most of what content does happens months before anyone fills in a form.
Stop reporting one number. Report three layers instead (direct, assisted and brand value) over a window you state up front. Count what you can track, estimate what you can't, and label which is which. That version survives a budget meeting.
Content Marketing ROI Is Revenue Set Against Your Full Content Cost
Most ROI reports go wrong on the inputs, not the formula. Take the revenue your content brought in. Subtract the total cost of making and distributing it. Divide by that cost, then multiply by 100.
A result of 100% means you doubled your money. Zero means you broke even. Anything negative means content cost more than it returned in the window you measured.
The revenue side should be closed revenue you can tie to content. If your margins are thin, use gross profit instead, so a $100 sale with $70 of costs doesn't count as $100 of return. Pipeline, leads and brand reach don't fit cleanly into this number. They get their own layers, covered below.
The cost side is where flattering reports are born. Freelance invoices and ad spend are easy to see. Staff time and software are easy to forget. Leave them out and your ROI looks great right up until finance checks it.
A Worked Example of One Year of Blog Content, in Dollars
A full cost list changes the answer more than most teams expect. The figures below are hypothetical. They describe a small team publishing two posts a month for a year.
Here are the cost lines that belong in the total.
| Cost line | How it's worked out | Annual cost |
|---|---|---|
| Marketer's time | 40% of a $90,000 salary | $36,000 |
| Freelance writers | 24 posts at $500 each | $12,000 |
| Tools | SEO, analytics and design software | $4,800 |
| Distribution | Newsletter and social scheduling | $1,200 |
| Paid amplification | Promoting top posts | $6,000 |
| Total | $60,000 |
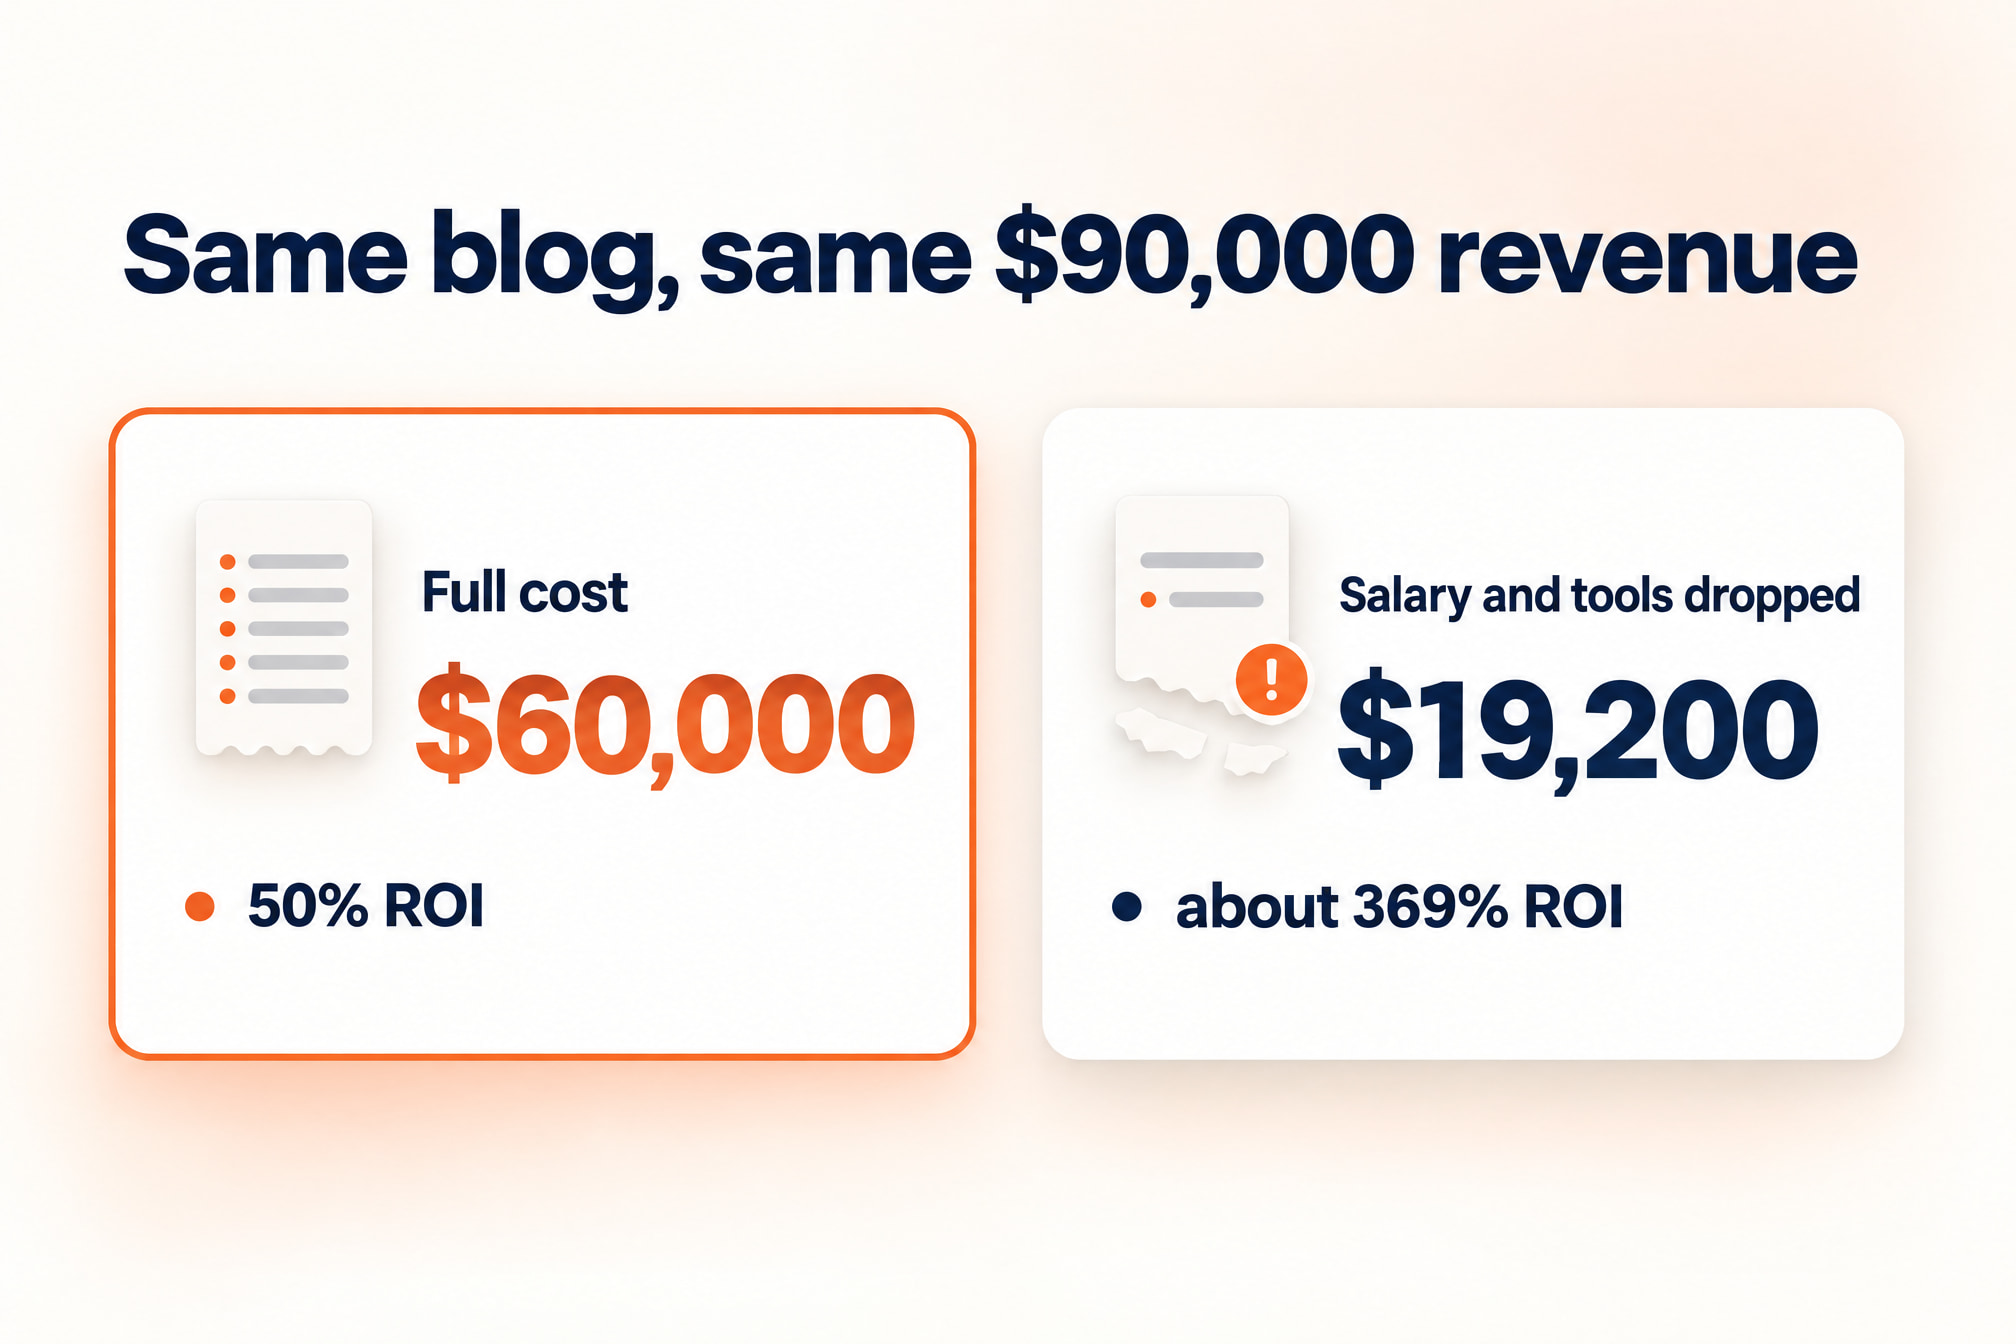
Say your analytics and CRM tie $90,000 of closed revenue directly to blog visits. The ROI is ($90,000 - $60,000) / $60,000 x 100, which comes to 50%.
Now drop the salary share and the tools, the two lines that are easiest to forget. Cost falls to $19,200. ROI jumps to about 369%. Same blog. Same revenue. One number is defensible and the other collapses the first time someone asks what the marketer does all day.
The split between lines will shift with how you staff. If you're deciding when to outsource content, the freelance line grows and the salary line shrinks. Both still belong in the total.
Content Has to Prove Its Return Because Budgets Stopped Growing
Content now competes for a slice of a marketing budget that has stopped getting bigger. Gartner's 2026 CMO Spend Survey put marketing budgets at 7.8% of company revenue, barely up from 7.7% in 2025. Gartner also notes that this share is 18% lower than the average four years earlier.
Inside that flat budget, money is moving. CMOs now put 15.3% of marketing budgets into AI, according to the same Gartner survey. Every new line item has to come from somewhere. A blog with no ROI story is an easy place to find it.
Few teams feel they're winning. The Content Marketing Institute surveyed 1,015 B2B marketers. Of those, 59% rated their marketing at least somewhat effective, but only 12% called it highly effective. Among those who rated themselves effective, 40% credited measurement and reporting. These are self-ratings, not measured returns. Still, measurement is high on the list of what confident teams credit.
Measuring well gets you three practical things. You can defend the content line item with a number instead of a feeling. A founder or CFO will trust a report that labels its estimates clearly. And you can move money from posts that drive nothing to topics and formats that do.
Content Earns Value in Three Layers, Each With Its Own Metrics
Content creates different kinds of value at different stages of the funnel, and a single ROI figure that counts only the bottom stage is wrong. Traffic and engagement belong to the top. Leads and conversion rates belong to the middle. Sales and revenue belong to the bottom.
This table maps each layer to its stage, its metrics and how firmly you can count it.
| Layer | Funnel stage | What it captures | Main metrics | How you count it |
|---|---|---|---|---|
| Direct | Bottom | Sales content closes | Revenue and conversion rate | Measured |
| Assisted | Middle | Deals content helped | Leads and assisted conversions | Partly measured |
| Brand | Top | Reach before buyers are ready | Traffic, engagement, branded search | Estimated |
Direct Revenue Is the Layer Last-Click Already Sees
Direct revenue is the easiest layer to prove and usually the smallest. It covers a visitor who reads a post and then buys, books a demo or signs up in the same session. Your analytics tool records it without extra work. Finance trusts it. Put it first in every report, but never let it stand alone.
Assisted Value Lives in Your CRM, Not Your Analytics
Assisted value is revenue from deals where content played a part before someone else closed them. Think of the comparison post a prospect read in March, or the case study a champion forwarded to their boss. Analytics loses these trails. Your CRM can keep them if each contact record stores the content they touched. Report assisted revenue separately, and credit content with a stated share of it rather than the whole amount.
Brand Value Shows Up Where Clicks Don't
Brand value is the hardest layer to count, and AI answers make it harder. Pew Research tracked 900 U.S. adults and found 58% saw at least one Google AI summary in March 2025. In the same study, users clicked a traditional result on 8% of visits when a summary appeared, against 15% when none did.
A page that gets cited can shape a buyer's thinking without ever earning a visit. Traffic alone will miss that. Track branded search volume, direct traffic and where you appear in AI answers. Knowing how Google's AI Overviews choose which pages to cite helps here, as does watching the SERP features that decide who gets the click.
Content Pays Back on a Longer Clock Than Your Quarterly Report
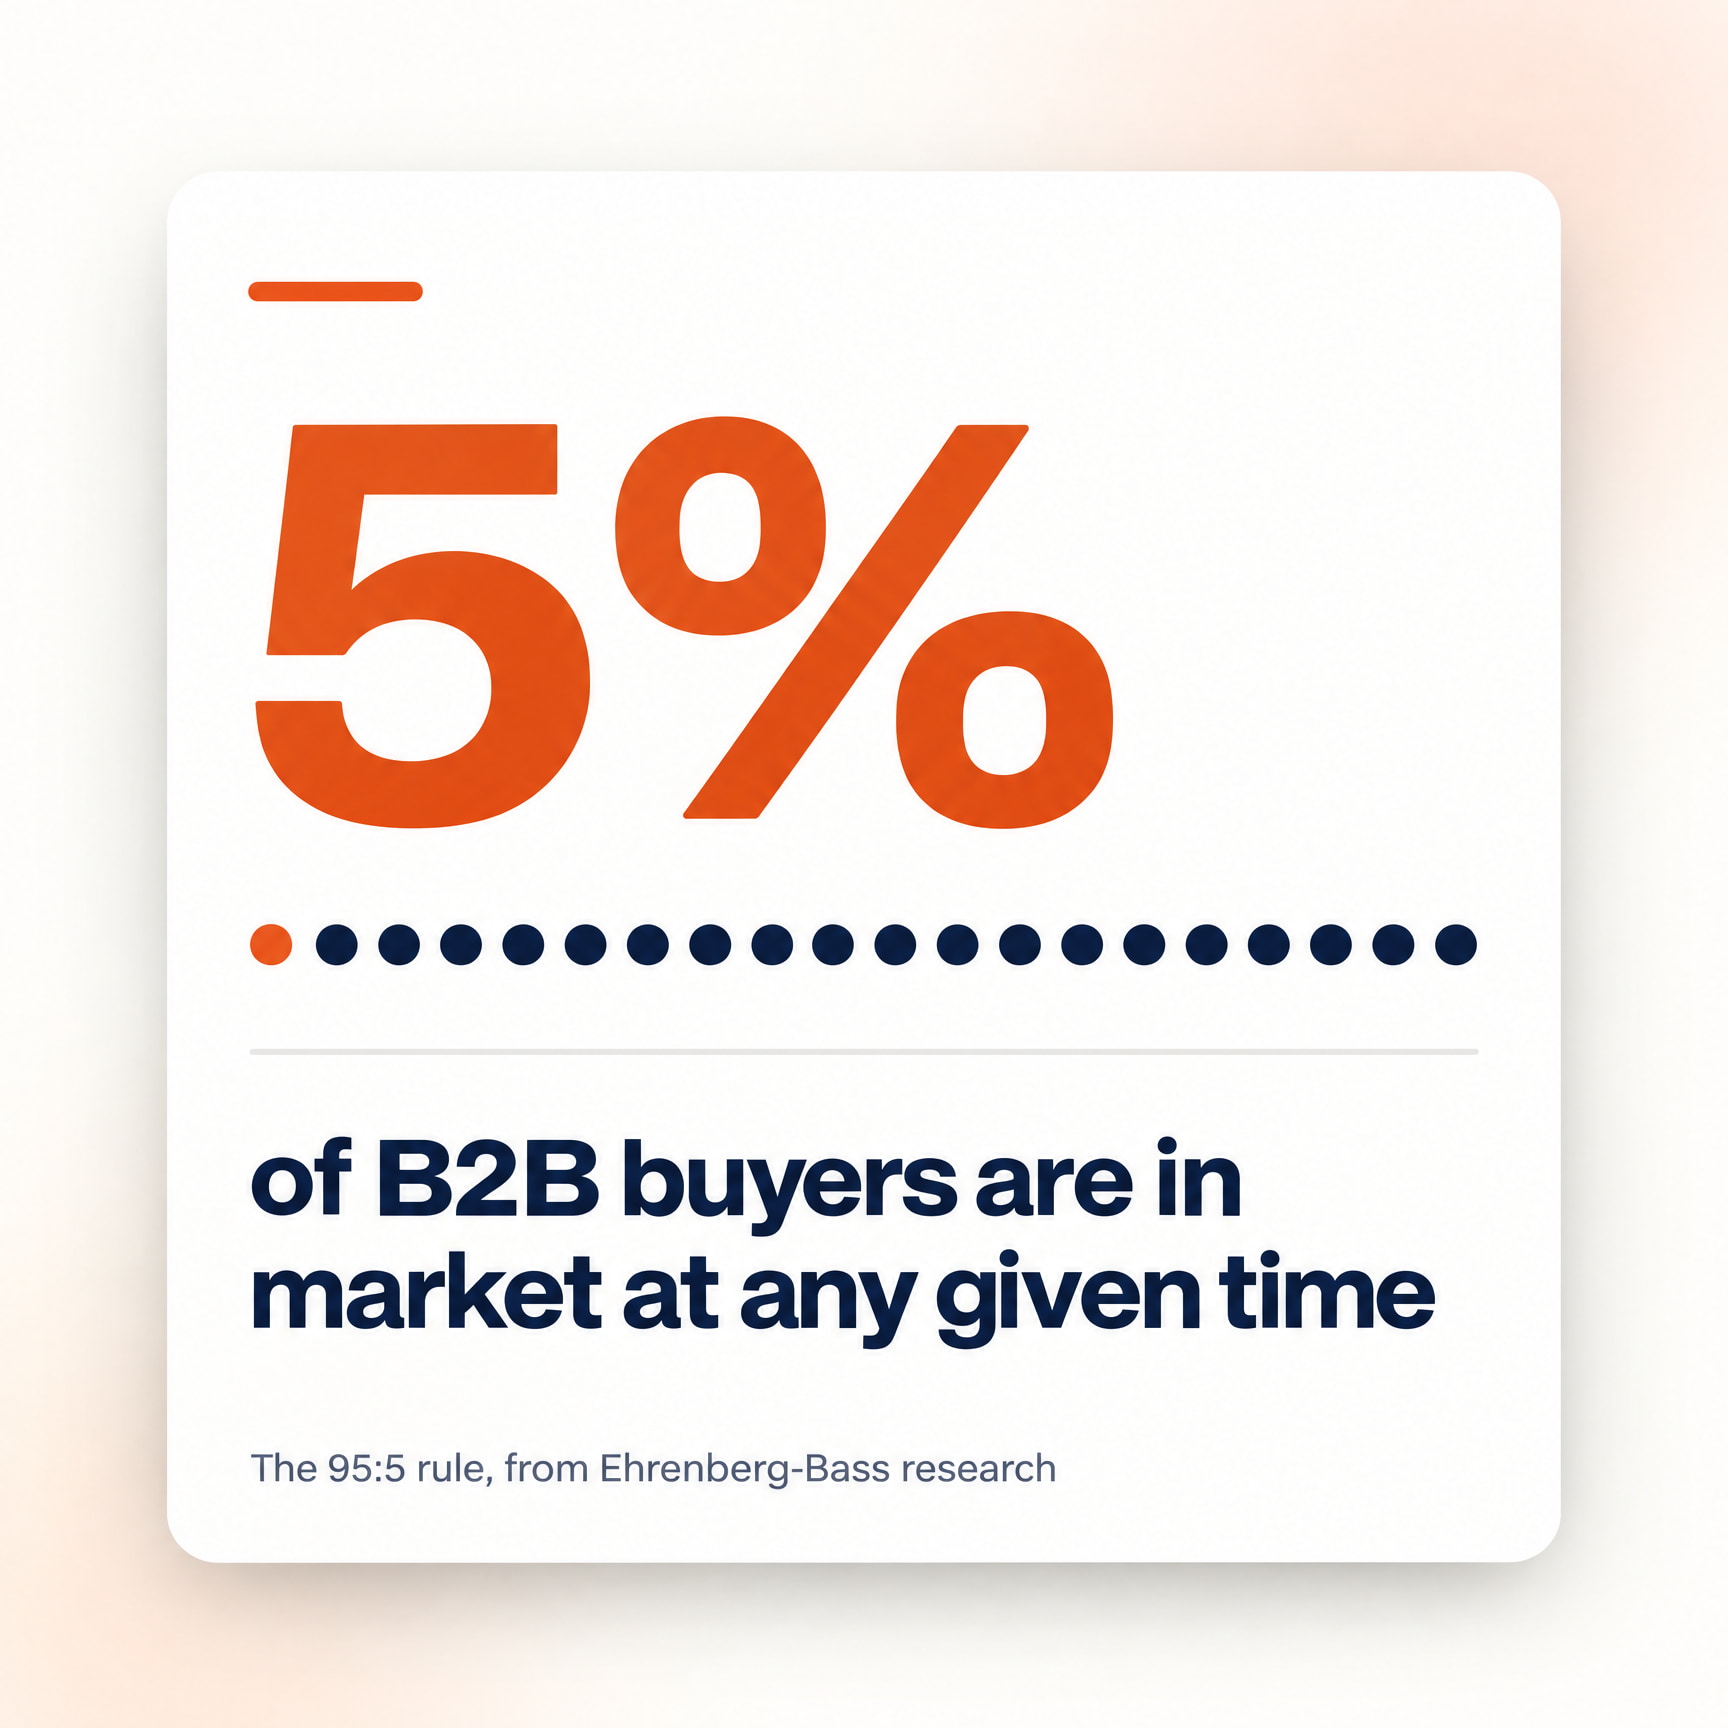
Most buyers your content reaches today won't buy for months, so a 30- or 90-day window will undercount content. The 95:5 rule, drawn from Ehrenberg-Bass research and explained in Marketing Week, holds that only about 5% of B2B buyers are in market at any given time. The other 95% won't buy for months or years.
When they do buy, the process is slow. Average B2B buying cycles fell from 11.3 months in 2024 to 10.1 months in 2025, per 6sense data reported by CustomerThink. Shorter, but still most of a year.
Buyers also do a lot of that work alone. In 2025, 6sense found that B2B buyers first contacted sellers about 61% of the way through their journey, down from 69%. By the time a lead shows up in your CRM, your content has already done much of its job. The form fill is a late signal.
Long cycles, delayed impact and indirect influence all point the same way. Set your window to match your sales cycle, and write it into the report. For most B2B blogs that means at least 12 months.
Binet and Field's B2B analysis for the LinkedIn B2B Institute recommends splitting budget roughly 50/50 between long-term brand building and short-term sales activation. If your content budget follows that split, about half of it is brand work. Judging that half on 90-day leads judges it on the wrong job.
Attribution Models Decide Who Gets Credit for a Sale
The attribution rule you pick can move content's ROI more than the content does. Single-touch models give all the credit for a conversion to one moment. Multi-touch models share it out.
The table compares the main models and where each stands in GA4 today.
| Model | Who gets credit | Effect on content | In GA4 today |
|---|---|---|---|
| First-touch | The first interaction | Flatters early-stage posts | Removed in 2023 |
| Last-touch | The final interaction | Undercounts most content | Available |
| Linear | Every touch equally | Fair but blunt | Removed in 2023 |
| Weighted | Touches by position or recency | Credits openers and closers | Removed in 2023 |
| Data-driven | Touches by modeled contribution | Google sets the weights | Available, the default |
In 2023, Google removed first-click, linear, time-decay and position-based attribution from Google Ads and GA4, as Search Engine Journal reported. That left data-driven and last-click. A Google spokesperson told Search Engine Land that fewer than 3% of Google Ads conversions used the retired models.
For a small team, this means GA4 alone won't show content's assist clearly. The workaround is cheap. Store each contact's first content touch in your CRM. Add a free-text "How did you hear about us?" field to your demo form. If you use HubSpot or a similar CRM with multi-touch reporting, use it for the assisted layer and keep GA4 for the direct one.
Tie Content Goals to Acquisition Cost and Lifetime Value
Customer acquisition cost and customer lifetime value turn content metrics into numbers a founder cares about. Most teams stop short of that. For thought leadership content, CMI found that 80% of B2B marketers track audience engagement, but only 63% track business impact.
Acquisition cost (CAC) is what you spend to win one customer. Lifetime value (CLV) is what that customer is worth over the whole relationship. If content wins customers more cheaply, or wins customers who stay longer, its ROI is larger than one year of revenue shows.
Use this checklist to connect content goals to those two numbers.
- Name one business objective per quarter, such as pipeline, signups or revenue.
- Pick one content KPI that feeds it, such as demo requests from blog pages.
- Work out CAC for content-sourced customers by dividing full content cost by customers whose first touch was content.
- Compare that figure with CAC from your paid channels.
- Track CLV for content-sourced customers separately from everyone else.
- Write the measurement window into the goal itself.
- Put the goal and its success metric in every content brief your writers work from.
How to Measure Content Marketing ROI in Seven Steps
Set this up once, then run it every month. It starts with tagging links and ends with each layer reported on its own.
- Tag every link you control. Add UTM parameters to links in newsletters, social posts and paid promotion so your analytics knows where each visit came from.
- Mark the actions that matter as conversions in GA4. Demo requests, trial signups and purchases count. Newsletter signups belong to the assisted layer.
- Connect HubSpot or your CRM. Keep each lead's first and last content touch on the contact record, so analytics and sales stop living in separate silos.
- Log every cost in one sheet. Record salary share, freelancers, tools, distribution and paid amplification each month.
- Choose your window before you look at results. Match it to your sales cycle. Picking the window after seeing the numbers is how reports lose credibility.
- Calculate the direct layer with the formula. Then total assisted revenue separately and decide, in writing, what share of it content gets.
- Report the three layers side by side. Label each figure as measured or estimated.
Good ROI Targets, and the Benchmarks You Should Distrust
Beat your other channels on full costs, over a stated window, and your content ROI is good. That comparison matters more than any industry average. In HubSpot's marketing statistics, marketers rank website, blog and SEO as their top ROI channel, ahead of paid social at 26%. HubSpot's 2026 data also names short-form video as the highest-ROI content format. Both are marketers' own rankings, not audited returns.
Two figures get repeated far more than they get checked.
- Myth: SEO returns 748%. Fact: Column Five explains that 748% is a conditional median for intensive thought-leadership SEO programs. It is not a general content marketing benchmark.
- Myth: 5:1, or 500%, is the bar every team should hit. Fact: Many guides quote it as a target. It is a rule of thumb, not a measured average.
Agency-published averages by channel or industry can help, if you check them first. Look for the method, the sample and the date. If a benchmark doesn't say how its returns were counted, you can't compare your full-cost number against it.
Two Scenarios Where One Blog Reports Very Different ROI
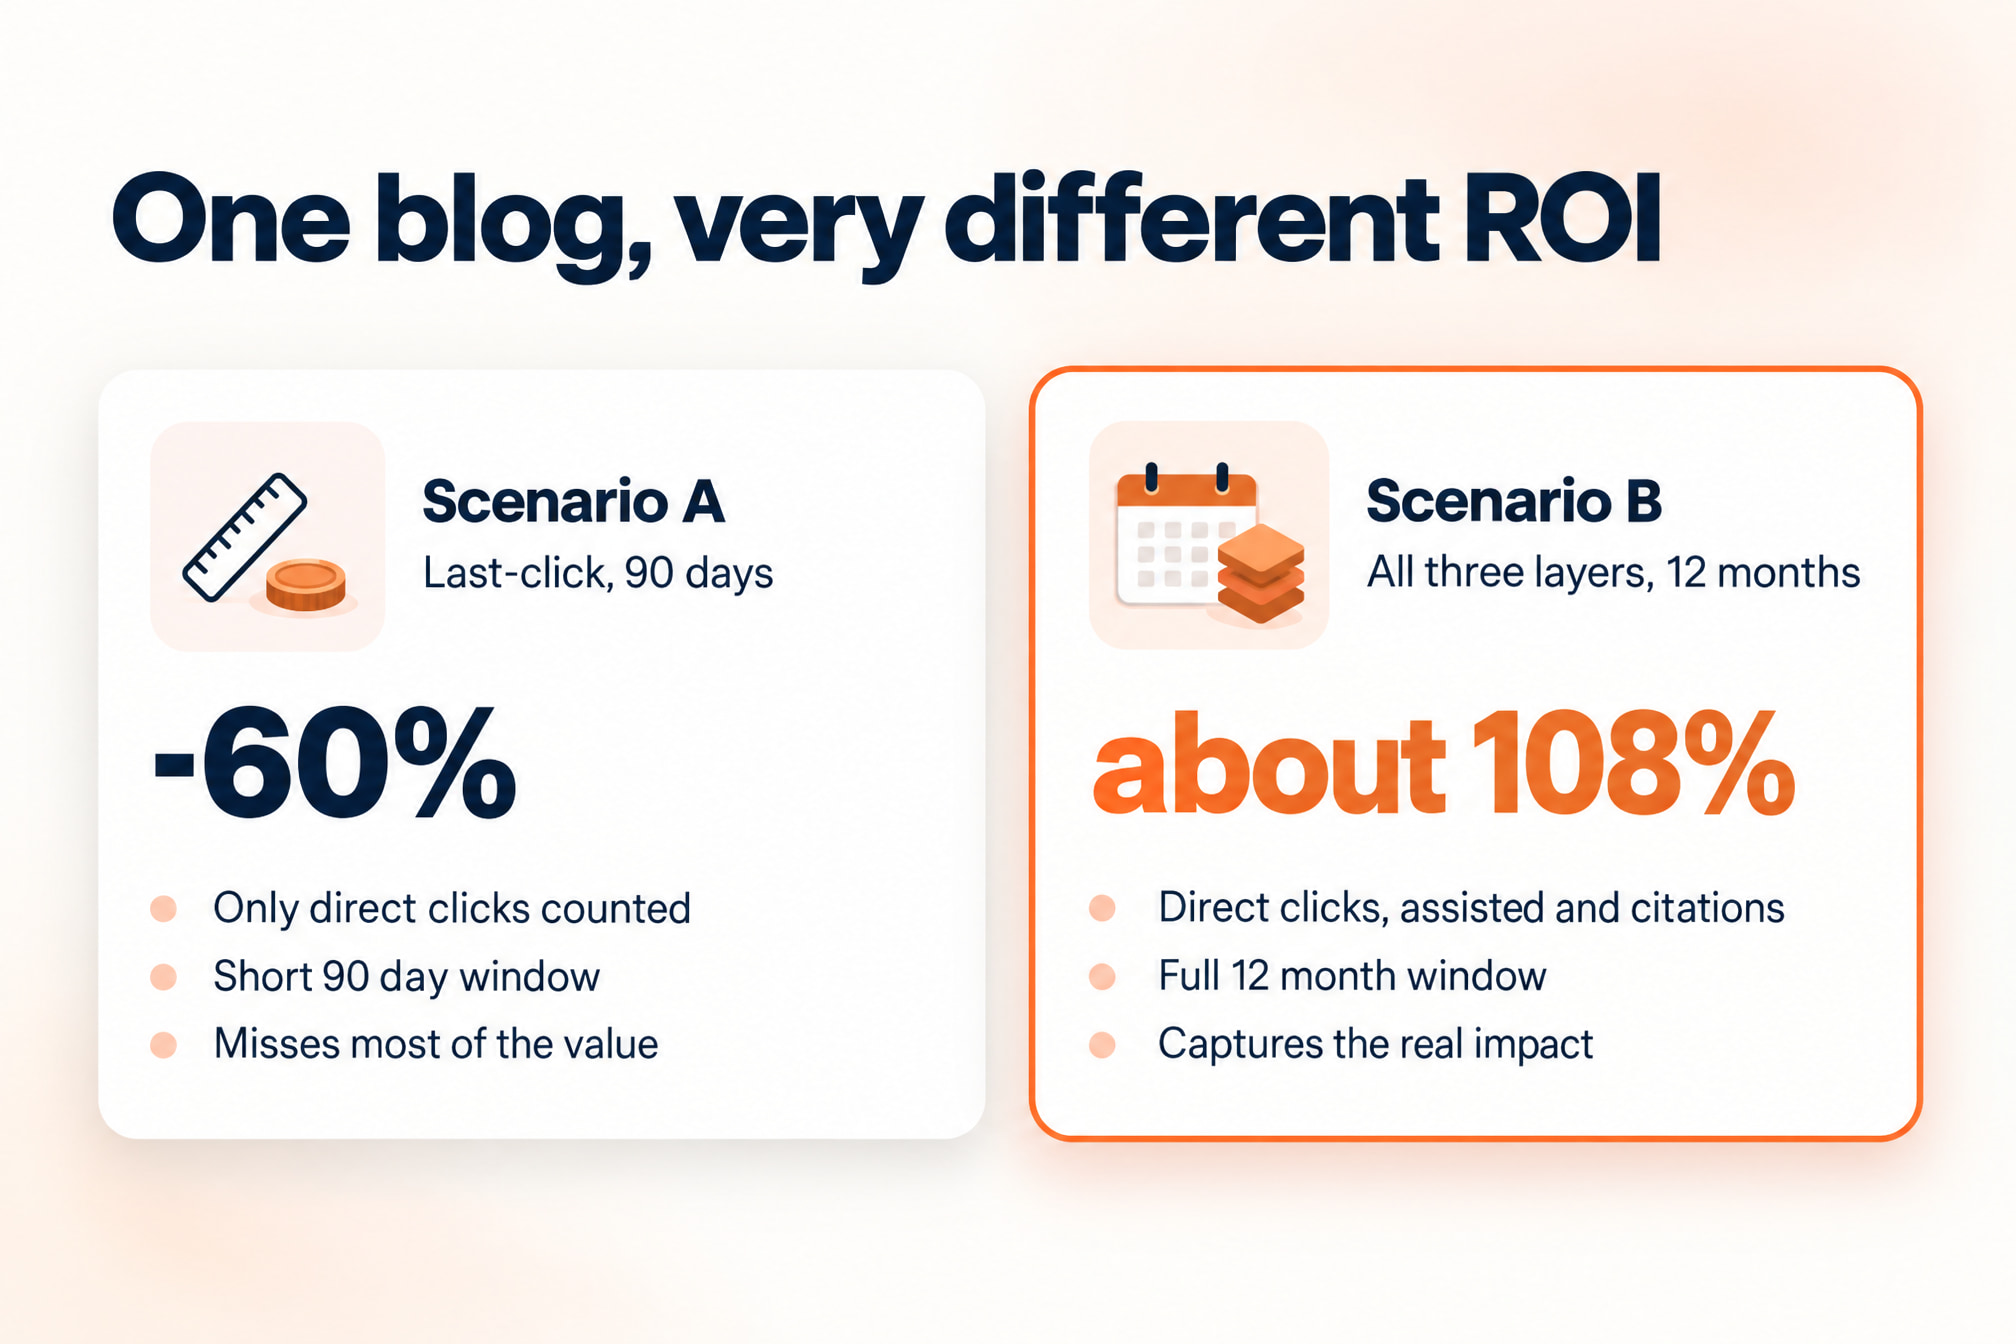
The same content program can report a loss or a clear win depending on the window and the layers you count. Both scenarios below are illustrative and use the blog from the worked example.
Scenario A Uses Last-Click Over 90 Days
The first quarter costs $15,000. Last-click attribution ties $6,000 of revenue to blog visits. The ROI is ($6,000 - $15,000) / $15,000 x 100, or -60%. On paper, the blog lost money. This is the report that gets content cut, and it's measuring a 10-month buying process with a three-month ruler.
Scenario B Counts All Three Layers Over 12 Months
The full year costs $60,000. Direct revenue is $90,000, a measured ROI of 50%. The CRM shows another $140,000 of closed deals where a contact touched content before buying. The team credits content with a conservative 25% of that, or $35,000. Combined ROI becomes ($125,000 - $60,000) / $60,000 x 100, about 108%.
Brand value goes in the report without a dollar figure. That might be branded search trending up and the blog cited in AI answers for its main topics. The direct number is measured. The 25% assist share is an estimate, and the report says so. Scenario A wasn't dishonest. It just stopped counting early.
Quick Answers on Content Marketing ROI
What Is a Good ROI for Marketing?
Positive after full costs, over a stated window, and better than the same money earns in your other channels. The often-quoted 5:1 is a rule of thumb, not a sourced benchmark.
How Do You Calculate Content Marketing ROI?
Subtract total content cost from the revenue content brought in, divide by total content cost, and multiply by 100. Include staff time, freelancers, tools, distribution and paid promotion in the cost.
Why Is Content Marketing ROI So Hard to Measure?
Content influences buyers long before they convert, and most B2B buyers aren't in market when they first read it. Short attribution windows and last-click models miss that earlier influence.
Which Attribution Models Does GA4 Still Offer?
Data-driven attribution, which is the default, and last-click. Google removed first-click, linear, time-decay and position-based models in 2023.
Put Your Content ROI in One Sentence
Paste this into your next report and fill in the brackets.
"Over [window], content cost [$X], drove [$Y] in direct revenue and assisted [$Z] in pipeline, with [metric] showing brand reach."
Fill in the direct layer first, this week. It's the one number nobody can argue with, and it earns you the room to explain the other two.
Need posts worth putting in that report? Serpjoy writes researched, cited posts in your voice. You can try one for $1.